CHAPTER 1: INTRODUCTION
1.1 Introduction
The human brain, capable of complex information processing, is monitored through electroencephalograms (EEG), enabling Brain-Computer Interfaces (BCI) to translate neural signals into actionable commands. EEG is critical in assisting individuals with neural disabilities, as it provides a preferred modality for Human-Machine Interaction (HMI). This research focuses on a cost-effective system for EEG signal acquisition, feature extraction, and classification tailored for wheelchair control. Unlike existing approaches requiring extensive computational resources, the proposed system leverages Fuzzy Logic and Adaptive Neuro-Fuzzy Inference Systems (ANFIS) to enhance real-time processing and reduce costs. Fuzzy Logic aids decision-making with interpretable rules, while ANFIS combines neural adaptability with fuzzy robustness, ensuring high classification accuracy. This innovative framework underscores the potential for reliable, real-world applications in assistive technologies.
1.2 Research Motivation
Neural disabilities, including conditions like ALS, brainstem strokes, and spinal cord injuries, impair neural pathways, severely restricting mobility and independence. Globally, over 10% of the population lives with some form of disability, with the majority residing in developing countries where access to assistive technologies is scarce. In Bangladesh alone, approximately 5 million individuals face paralysis, exacerbated by socio-economic challenges such as poverty and inadequate healthcare infrastructure. Addressing these issues, this research proposes a Brain-Computer Interface (BCI) system to empower individuals with neural disabilities. By providing an accessible and cost-effective solution, this system aims to enhance mobility, independence, and quality of life while advancing the field of assistive technologies.
1.3 Objectives and System Overview
This research aims to develop a cost-effective Brain-Computer Interface (BCI)-based system for real-time wheelchair control, enhancing mobility for individuals with neural disabilities. The key objectives are:
- EEG Signal Acquisition and Preprocessing: Acquire high-quality EEG signals with minimal noise and prepare them for analysis.
- Feature Extraction and Dimensionality Reduction: Employ advanced techniques to extract critical features and reduce redundancy.
- Reliable Classification: Design FIS and ANFIS classifiers to interpret EEG signals accurately, ensuring computational efficiency and scalability.
- Automated Wheelchair Control: Translate EEG signals into precise, real-time commands for wheelchair movement.
- Ease of Use and Reliability: Develop a system that is user-friendly and dependable in practical environments. The system’s architecture integrates EEG acquisition, feature extraction, classification, and control mechanisms, offering a robust and scalable solution for assistive mobility
The primary focus is to design a classifier for EEG signals to control an automated wheelchair effectively, emphasizing Fuzzy Logic for its balance between simplicity and accuracy. The system’s architecture, illustrated in Figure 1.1, outlines the interconnected components, each detailed in subsequent chapters.
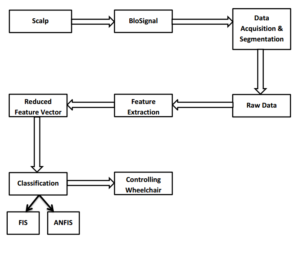
Figure1.1: Overview of the system
1.4 Expected Outcomes
This research aims to deliver a reliable, cost-effective system for acquiring, processing, and classifying EEG signals for wheelchair control. The anticipated outcomes include:
- High-quality EEG data acquisition with minimal noise, ensuring robustness in real-world conditions.
- Precise feature extraction and dimensionality reduction methods to enhance classification accuracy while maintaining computational efficiency.
- The development of FIS and ANFIS classifiers with classification accuracy exceeding 90%, demonstrating superior performance over traditional methods.
- Real-time translation of classified EEG signals into actionable wheelchair control commands with minimal latency.
- A scalable and user-friendly system capable of empowering individuals with neural disabilities by improving their mobility and independence.
These outcomes will significantly advance the state of assistive technologies by providing an affordable and efficient solution for individuals with neural disabilities.
CHAPTER 3: FEATURE EXTRACTION
Feature extraction is a crucial step in the development of any Brain-Computer Interface (BCI) system. It involves transforming raw EEG signals into a set of meaningful features that can be used for classification. This chapter describes the methodologies and techniques used to extract time-domain and frequency-domain features, as well as the dimensionality reduction processes employed to ensure computational efficiency.
3.1 Time-Domain Features
Time-domain features are directly derived from the EEG signal’s amplitude over time. These features provide insights into the signal’s statistical and temporal properties. For this research, the following features were extracted:
- Mean Value: Represents the average amplitude of the signal, providing a baseline for signal activity.
- Median: Offers a measure of central tendency, robust to outliers.
- Standard Deviation: Captures the variability or spread of the signal amplitude.
- Skewness: Measures the asymmetry of the signal distribution, indicative of transient events.
- Kurtosis: Reflects the peakedness of the signal distribution, useful for identifying sharp spikes or irregularities.
3.2 Frequency-Domain Features
Frequency-domain features characterize the power distribution of the EEG signal across different frequency bands. These features were derived using spectral analysis techniques:
- Power Spectral Density (PSD): Quantifies the power present in various frequency bands, such as delta (0.5-4 Hz), theta (4-8 Hz), alpha (8-12 Hz), beta (12-30 Hz), and gamma (30+ Hz).
- Entropy: Measures the signal’s randomness or complexity, highlighting variations in brain activity.
3.3 Feature Projection and Dimensionality Reduction
To optimize the feature set and reduce computational overhead, Principal Component Analysis (PCA) was employed. PCA transforms the extracted features into a new set of orthogonal components, retaining the most variance-contributing components while discarding redundant or less significant features. This step ensures that only the most relevant information is passed to the classifier.
3.4 Tools and Software
Feature extraction was performed using the Biopac Acknowledge software, which provides advanced tools for analyzing EEG signals. Key advantages include:
- Real-time and post-hoc data analysis.
- Automatic computation of statistical measures such as mean, PSD, and entropy.
- Integrated visualization tools for validating feature extraction.
Key features such as entropy and power spectral density were calculated using the software’s graphical interface. The ability to annotate, transform, and store data efficiently enables high-quality analysis with minimal effort, making AcqKnowledge an essential tool for EEG feature extraction and visualization.
As we discuss above about this software, we calculated different features easily and shown graphically. Some of the extracted features for example entropy, power spectral density is given below

Figure 3.1: PSD for subject 1 while thinking forward
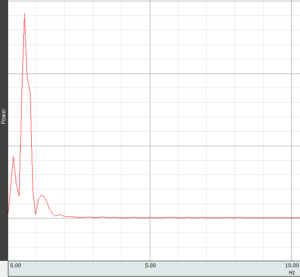
Figure 3.2: PSD for subject 1 while thinking left

Figure 3.3: Entropy for subject 1 while thinking forward

Figure 3.4: Entropy for subject 1 while thinking left
CHAPTER 4: FUZZY LOGIC & NEURAL NETWORKS
Fuzzy logic and neural networks are pivotal components in the classification of EEG signals for this research. Fuzzy logic provides interpretability and robustness in handling uncertainty, while neural networks enable adaptability and data-driven learning. This chapter discusses the theoretical underpinnings, implementation, and integration of these techniques, focusing on the development of Fuzzy Inference Systems (FIS) and Adaptive Neuro-Fuzzy Inference Systems (ANFIS) to classify mental commands for wheelchair control.
4.1 Fuzzy Logic
4.1.1 Overview of Fuzzy Logic
Fuzzy logic operates on a continuum of truth values between 0 and 1, as opposed to binary logic’s strict true/false dichotomy. This approach is well-suited for decision-making processes involving imprecise or noisy data, such as EEG signals.
4.1.2 Fuzzy Inference System (FIS)
The FIS implemented in this research uses membership functions and rule-based logic to classify EEG features. Key steps in the design of the FIS include:
- Input Membership Functions (MFs): Gaussian MFs were employed to model EEG feature distributions.
- Rule Base: Linguistic rules, such as “IF Mean is High AND PSD is Low THEN Command is Forward,” were developed based on feature patterns.
- Defuzzification: The Center of Gravity method was used to convert fuzzy outputs into crisp classifications.
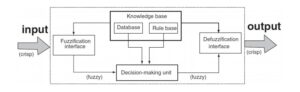
Figure 4.1: Fuzzy Inference System
4.2 Neural Networks
4.2.1 Overview of Neural Networks
Neural networks are computational models inspired by the human brain. They consist of interconnected neurons organized into layers. Each neuron processes inputs through activation functions, enabling the network to learn complex patterns from data.
4.2.2 Neural Network for EEG Classification
For this research, a Multi-Layer Perceptron (MLP) architecture was employed with:
Input Layer: Features such as Mean, Median, and PSD were fed into the network.
Hidden Layers: One or more layers with sigmoid activation functions enabled non-linear mapping.
Output Layer: The final layer provided probabilistic classifications for commands like forward, backward, and stop.
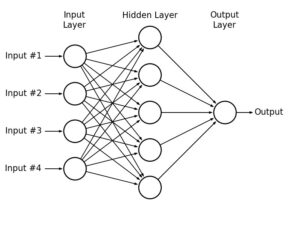
Figure 4.2: A standard three layers feed-forward NN
4.3 Adaptive Neuro-Fuzzy Inference System (ANFIS)
4.3.1 Hybrid System
ANFIS combines the interpretability of fuzzy logic with the learning capability of neural networks. It refines fuzzy rules and membership functions through supervised learning, improving classification accuracy.
4.3.2 ANFIS Implementation
The ANFIS classifier was trained using EEG features and corresponding mental command labels. Key aspects include:
- Architecture: A five-layer feed-forward structure was used. Layers included fuzzification, rule evaluation, normalization, defuzzification, and output.
- Training Algorithm: A hybrid learning algorithm combining gradient descent and least-squares estimation optimized both premise and consequent parameters.
- Performance: ANFIS outperformed standalone FIS by adapting to new data and reducing classification errors.
4.4 Comparison of FIS and ANFIS
Metric | FIS | ANFIS |
Accuracy (%) | 91.7 | 97.3 |
Training Data | Expert Rules | Data-Driven |
Adaptability | Limited | High |
Complexity | Moderate | High |
This chapter detailed the use of fuzzy logic and neural networks in the classification framework. FIS provided simplicity and interpretability, while ANFIS demonstrated superior adaptability and accuracy. The integration of these paradigms forms the foundation for the real-time classification of EEG signals and enhances the system’s effectiveness in practical applications.
CHAPTER 5: CLASSIFICATION USING EEG SIGNALS
After data acquisition and preprocessing, EEG signal classification is performed using numerical or parametric methods. Numerical classifiers match new cases to stored examples but are computationally inefficient. Parametric classifiers estimate model functions, avoiding large databases and capturing feature relationships. While basic parametric methods handle linear relationships, advanced techniques like Neural Networks (NN) and Fuzzy Inference Systems (FIS) are ideal for modeling the nonlinear dependencies typical in EEG data.
5.1 FIS Classifier
Fuzzy Inference Systems (FIS) and Artificial Neural Networks (ANN) effectively handle the nonlinear nature of EEG signal parameters. These higher-order classifiers require training, where datasets are divided into training and validation sets to ensure accurate classification results. Cross-validation, a key concept in this process, is discussed further in the “Cross Validation” section. The training process is outlined in Figure 5.1, highlighting the differences between the training stage and the final evaluation stage, detailed in the “Evaluation Stage” section.
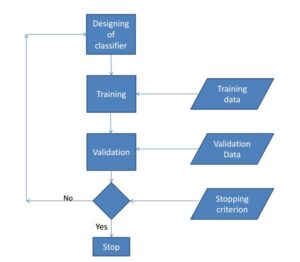
Figure 5.1: Basic Principle of FIS classifier design
When using higher-order classifiers several pitfalls have to be dealt with. If the model order of the classifier is too high the model may over fit the training data, which can lead to poor classification results during cross validation. The consequential application of cross validation methods during training can only cope with this problem to a certain degree.
Fuzzy inference systems (FIS) use membership functions, typically Gaussian, to model parameter distributions, accommodating non-Gaussian and multi-cluster data through multiple overlapping functions. Now the Working procedure FIS system can be represented by the figure 5.2 below
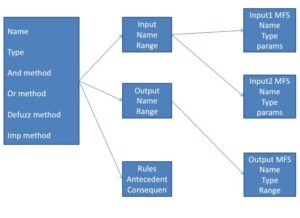
Figure 5.2: Working principle of FIS system
5.2 ANFIS Classifier
The advantage of the fuzzy inference system is that it can deal with linguistic expressions and the advantage of a neural network is that it can be trained and so can self-learn and self-improve. Jang (1993) took both advantages, combining the two techniques, and proposed the Adaptive Neuro-Fuzzy Inference System (ANFIS). The main work principle of ANFIS can be described by the Figure 5.3, 5.4 & 5.5

Figure 5.3: Working principle of ANFIS
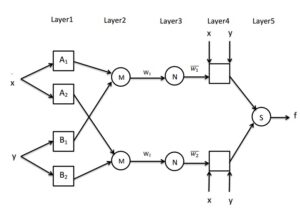
Figure 5.4: Adaptive Neuro-Fuzzy Inference System architecture

Figure 5.5: Block diagram of a typical ANFIS with Sugeno fuzzy inference system
5.3 Performance of Classifier
The performance of a classifier depends on two key aspects:
Interpretability: The model’s clarity in representing system behavior, including minimal input variables, simple linguistic terms, concise rules, and comprehensible fuzzy sets.
Accuracy: The model’s ability to closely replicate the system’s actual behavior, ensuring reliable and precise responses.
CHAPTER 6: FIS & ANFIS CLASSIFIER DESIGN
The purpose of the author’s study was to gather data necessary for creating classifiers for each decision. Data from subjects meeting the required seven features were used. The extracted features from the random EEG signals of the subjects served as input for both the FIS and ANFIS
classifiers. The main difference between FIS and ANFIS is that the FIS classifier uses the Mamdani Fuzzy Inference System, whereas ANFIS uses the Sugeno Fuzzy Inference System. MATLAB Toolboxes, including the Fuzzy Inference System (FIS) Editor and Adaptive Neuro-Fuzzy Inference System (ANFIS) Editor, were utilized for both classifiers.
6.1 FIS Classifier Design
The FIS classifier is designed based on the Mamdani-type Fuzzy Inference System. The design of the FIS classifier primarily depends on the number of inputs and outputs. The greater the number of inputs, the more rules will be required. Each input and output is associated with a certain number of membership functions (MFs). An increase in the number of membership functions leads to an increase in the number of rules, which in turn increases both the complexity and accuracy of the classifier. However, excessive complexity can make the system unstable. Accuracy, being the most critical parameter, must be maintained at an acceptable level while designing the classifier.
For the FIS classifier for EEG signals, seven input parameters were used. These seven features were extracted from random EEG signals. While it is possible to extract additional features and include more inputs in the FIS classifier, doing so would significantly increase complexity. In some cases, MATLAB may be unable to handle the large number of rules in its memory. Therefore, it is necessary to select only those inputs that are vital and have a strong correlation with the output decisions while excluding less relevant parameters. After identifying the seven most vital features, five membership functions were defined for each input.
This design approach results in a FIS classifier with high accuracy but also high complexity. To manage this, the number of outputs was reduced. For wheelchair control, six decisions are required: forward, left, right, backward, stop, and normal. Instead of creating six outputs, a single output with six membership functions was used to represent the decisions. This reduces the number of outputs and simplifies the system without compromising accuracy. However, the number of inputs cannot be reduced through this process, as outputs depend on inputs, but inputs are independent of outputs.
The FIS classifier can be implemented in five steps:
- Fuzzify the inputs and create input membership functions (InMFs).
- Set the range of the input membership functions.
- Create output membership functions (OutMFs) and set their range.
- Define the rule base for the corresponding input and output membership functions.
- Defuzzify the processed data to generate the output.
6.1.1 Fuzzified the Input and Create Input Membership Functions (InMFs)
The list of input variables and decision to taken given in the table below.
Input variables (Feature) | Decision | Input Membership Functions |
Mean | Froward | Very Low (VL) |
Median | Left | Low(L) |
Standard Deviation | Right | Medium(M) |
Skewness | Backward | High(H) |
Kurtosis | Stop | Very High (VH) |
PSD | Normal | |
Entropy |
The fuzzification process:

Figure 6.1: Fuzzification of input variables
Create input membership functions:
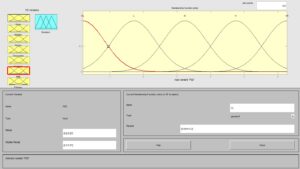
Figure 6.2: Membership function (VL, L, M, H, VH)
6.1.2 Set the Range of Input Membership Function
Setting the range of the membership function is very important because the output directly depend on this. We found the minimum and maximum value of every input variable. And set the params according to the number of membership function. Range setting process given by the figure 6.3 below.

Figure 6.3: Setting the range of input MFs
Design parameters of Set the range of input member ship function given in the tables below:
Inputs/ Feature | Mean | Median | Stddev | Skewness |
Range | -7.7to2.8 | -9.027to.8 | -7.86to22.2 | -.049to.73 |
VL | ~to-7.7 | ~ to-9.027 | ~ to -7.86 | ~ to-.049 |
L | -7.7to-5.053 | -9.027to-6.544 | -7.86to-.345 | -.049 to.1457 |
M | -5.053to-2.461 | -6.544 to-4.113 | -.345 to 7.17 | .1457 to.3405 |
H | -2.461to.175 | -4.113to-1.647 | 7.17 to14.68 | .3405 to.5353 |
VH | .175 to2.8 | -1.647to.8 | 14.68 to22.2 | .5353 to.73 |
Inputs/ Feature | Kurtosis | PSD | Entropy |
Range | 2.7to5.58 | .2to6.27 | -11.05to1.2 |
VL | ~to2.7 | ~to.2 | ~to-11.05 |
L | 2.7to3.42 | .2to1.717 | -11.05to-7.988 |
M | 3.42to4.14 | 1.717to3.235 | -7.899to-4.925 |
H | 4.14to4.86 | 3.235to4.752 | -4.925to-1.863 |
VH | 4.86to5.58 | 4.752to6.27 | -1.863to1.2 |
6.1.3 Create Output Membership Functions and Setting the Range
The output membership function is important for designing a FIS classifier because values of the range directly connected with the decision. For this triangular shaped membership function is used. The process can be easily understood by the given figure 6.5

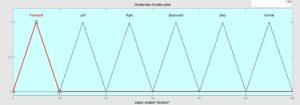
Figure 6.5: Creation of output membership functions and range
Design parameters of Create output membership functions and setting the range given in the tables below:
Decision | Range |
Froward | 0-10 |
Left | 20-10 |
Right | 20-30 |
Backward | 30-40 |
Stop | 40-50 |
Normal | 50-60 |
6.1.4 Set the Rule Base for The Corresponding Input and Output Membership Function (OntMFs)

Figure 6.6: Rule base
6.1.5 Defuzzified the Processed Data into Output
To understand the fuzzified data Defuzzification is needed. The process of defuzzifiacation of processed data can be given by figure 6.7
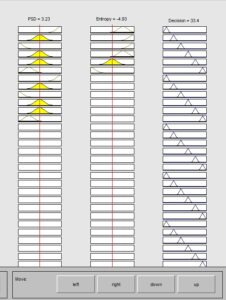
Figure 6.7: Defuzzification process
6.2 ANFIS Classifier Design
ANFIS is a five-layer neural network. The accuracy of the ANFIS is revolutionary. The layers are:
- Input layer (Layer 1)
- MF layer (Layer 2)
- Rule layer (Layer 3)
- Norm layer (Layer 4)
- Output layer (Layer 5)
A huge amount of data is needed for the greater accuracy of the classifier. ANFIS will achieve more accuracy if trained with a large amount of data. So more the data more the accuracy trained with. The extracted feature referred as data. This data would be split in equal halves in order to form two representative data sets. One would be used for training, and the other would be used for testing the classifier. We created our classifier using Matlab’s Fuzzy Toolbox’s Adaptive Neuro-Fuzzy Inference System (ANFIS), which uses neural networks in order to train the classifier. ANFIS applies the learning abilities of neural networks to detect trends in the training data. From these trends, ANFIS can generate the fuzzy if-then rules of the classifier. The benefit of using ANFIS is that if we do not have a conceptual view of what our system, membership functions and rules should be, ANFIS can create this for us automatically. The resulting system will be adapted to the data, and accommodate any variations. ANFIS is limited to using Sugeno systems.
The design of ANFIS classifier can be done in seven steps.
The design process ANFIS classifier for EEG data can be represent by a group of figures 6.8-6.14 below
- Load train data form MATLAB workspace:
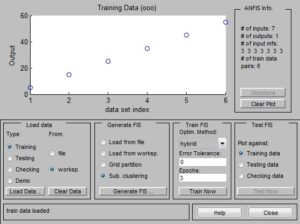
Figure 6.8: Load train data
- Load check data from MATLAB workspace:

Figure 6.9: Load check data
- Generate FIS with sub clustering
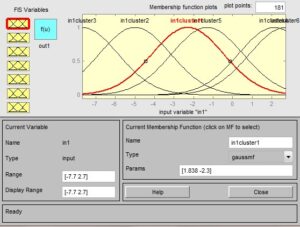
Figure 6.10: Generate FIS
- Train ANFIS with back propagation algorithm

Figure 6.11: Train ANFIS with back propagation algorithm
- Set error tolerance and epochs

Figure 6.12: Setting error tolerance and epochs
- Test the data with the checking data
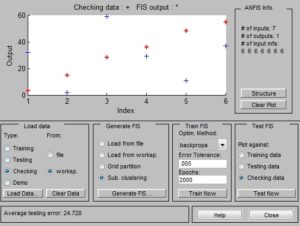
Figure 6.13: Test the data with the checking data
- Defuzzification of the processed data to the output
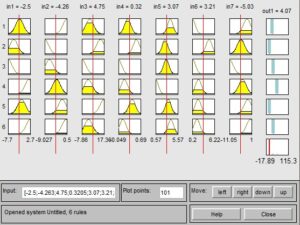
Figure 6.14: Defuzzification of processed data
The data set we used to train the ANFIS:
After designing the ANFIS classifier the internal architecture of the ANFIS will be like

Figure6.15: The internal architecture of the ANFIS
CHAPTER 7: FIS & ANFIS CLASSIFIER’S APPLICATION (WHEELCHAIR CONTROLLING)
The Fuzzy classifier decisions—forward, left, right, backward, stop, and normal—are used to control the wheelchair, designed for individuals with neural disabilities such as paralysis. The system interprets real-time EEG signals from the patient and processes them to guide wheelchair movement. For effective operation, all components—data acquisition, feature extraction, classification, and control—must function continuously and synchronously.
The key steps include:
- EEG Data Acquisition: Capture signals while minimizing noise and artifacts caused by external interference or poor sensor contact.
- Feature Extraction: Extract essential features, reduce dimensionality, and eliminate redundant information from EEG signals.
- Classification: Apply pattern recognition and translation algorithms to categorize EEG data into actionable commands.
- Control Mechanism: Convert classified categories into control commands to execute wheelchair movements.
Control implementation can be achieved either by interfacing the MATLAB Fuzzy Logic Toolbox with a microcontroller or by embedding the complete process into a standalone microcontroller algorithm.
7.1 Fuzzy Logic Controller (FLC)
The Fuzzy Logic Controller (FLC) utilizes fuzzy logic outputs to control devices, including wheelchairs. Fuzzy logic enhances classical set theory by allowing “degrees of membership” to range between 0 and 1, enabling nuanced decision-making. Linguistic terms like “Right,” “Forward,” and “Left” describe input values, with membership degrees indicating their intensity (e.g., “Low” or “High”).
FLC operates as a rule-based system, converting crisp inputs into fuzzy values via fuzzification. These inputs are scaled to match the universe of discourse, ensuring adaptability across devices. The decision-making logic applies fuzzy IF-THEN rules (using Sup-Min inference) to derive outputs, which are defuzzified into crisp values, typically using the center of gravity method.
Key components of an FLC:
- Fuzzification Interface: Maps input values into fuzzy sets.
- Knowledge Database: Includes a database for linguistic definitions and a rule base for control policies.
- Defuzzification: Converts fuzzy outputs into crisp values for actionable decisions.
- Synchronization: Ensures seamless output integration with a microcontroller.
This scalable and flexible approach supports efficient real-time control of devices.
FLC can be represented by a Figure7.1
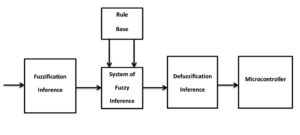
Figure 7.1: Architecture of the FLC
7.2 Controlling Process Through FLC
The defuzzified output is fed into an 8-bit microcontroller to implement the Fuzzy Logic Control (FLC) algorithm for wheelchair control. FLC provides a robust alternative to traditional control techniques, offering real-time solutions using inexpensive hardware without specialized software tools.
Implementation Highlights:
- Fuzzy Logic in Embedded Systems: FLC has been widely adopted in control applications due to its ability to handle non-linear dynamic processes. It translates sensor inputs into actuator outputs using linguistic “If-Then” rules and enables fine-tuning through trial-and-error methods.
- Architecture: The system incorporates fuzzification, rule evaluation, and defuzzification to create a closed-loop control system for wheelchair movement.
- Hardware and Techniques: The Atmel AVR Atmega8 microcontroller is used for real-time fuzzy-based control. The approach optimizes performance with minimal development time.

Figure 7.2: Architecture of the fuzzy logic control algorithm in embedded microcontroller
CHAPTER 8: RESULT ANALYSIS & DISCUSSION
Electroencephalography (EEG) records the brain’s electrical activity and serves as the foundation of this project. EEG signals, generated during various mental states, enable better understanding of human activities, such as limb movement or eye blinks, and are critical for Human-Machine Interaction systems. Unlike other biosignals (ECG, EMG, EOG), EEG directly reflects brain activity, making it ideal for decision-making processes. For effective classification, raw EEG signals must be preprocessed to reduce noise and enhance relevant information. Feature extraction identifies meaningful data within the signal, forming the basis for classification. The classification step assigns a class to these features, defining specific mental tasks, which are then used in practical control applications, such as wheelchair navigation.
8.1 EEG Data Acquisition
There is many software used and evolved recently for analyzing real time EEG signals. Most used software’s among them are Biopac Student Laboratory, Acknowledge 4.1, MATLAB, Openvibe, Labview and Bio electromagnetism. We use Biopac Student Laboratory to acquisite EEG data.
Device we used for the acquisition of EEG signal given in below figure 8.1

Figure8.1: BIOPAC machine
Electrode formation used for the subject is given in below
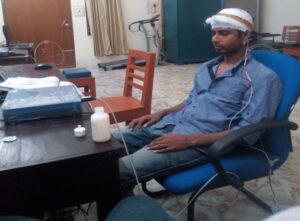
Figure 8.2: Electrode Formation
Impedance match and noise check of the electrodes of the BIOPAC machine is given in figure 8.3 below

Figure 8.3: Impedance check
The electrodes must be connected to the subject skull in such that impedance must be under the 10kΩ .
We acquisite EEG signal from 8 subjects. For the wheel chair control, we have to collect EEG signals from the subject in six different conditions i.e. forward, left, right, backward, stop and normal. Because these are the possible directions of the wheelchair. But for example, six conditions for only one subject’s EEG data are shown by the figure8.4-8.7 below

Figure8.4: EEG signal while subject think forward

Figure 8.5: EEG signal while subject think left
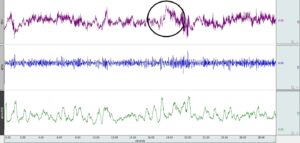
Figure 8.6: EEG signal while subject think Right

Figure 8.7: EEG signal while subject think Backward
8.2 Feature Extraction
Feature extraction is a critical step in analyzing EEG signals, aimed at identifying properties essential for control applications.
EEG data, collected using three electrodes (negative, positive, and ground), carries vital information related to decision-making tasks. These extracted properties, referred to as “features,” represent the signal’s key characteristics and are organized into a “feature vector.” Effective feature extraction ensures that only meaningful and relevant information is provided to the classification algorithm, minimizing redundancy and noise while enhancing system performance.
For this research, EEG signals were acquired from eight subjects using Acknowledge 4.1 software. Following data processing, valid features were extracted for six subjects, corresponding to six decisions: forward, left, right, backward, stop, and no movement (normal). The features extracted include statistical measures such as mean, median, standard deviation, skewness, and kurtosis, alongside frequency-domain measures like power spectral density (PSD) and entropy. These features provide a comprehensive representation of the EEG signal’s dynamics, forming the foundation for accurate classification and effective control of the system, enabling real-time decision-making and robust performance.
In the table below, abbreviations are used: R (Right), L (Left), F (Forward), B (Backward), S (Stop), and N (No movement).
Table 8.1: Extracted Feature from subject 1
Feature | F | L | R | B | S | N |
Mean | -3 | -0.48 | -1.3 | 3.53 | 0.56 | -7.7 |
Median | -9.03 | 0.13 | -1.4 | -3.3 | 0.71 | -7.9 |
Stddev | 4.38 | 22.2 | 7.1 | -3.3 | 0.71 | -7.9 |
Skewness | 0.73 | 0.39 | 0.2 | 0.19 | 0.14 | -0 |
Kurtosis | 2.7 | 3.85 | 3.9 | 5.58 | 3.6 | 3.08 |
PSD | 6.27 | 2.82 | 0.2 | 1.9 | 1.98 | 0.3 |
Entropy | -2.19 | -1.5 | -1.1 | -2.4 | -4.2 | -11 |
Table 8.2: Extracted Feature from subject 2
Feature | F | L | R | B | S | N |
Mean | -5 | -1.3 | -2.3 | 2.7 | 2.13 | -7.7 |
Median | -9.03 | -1.47 | 0.5 | 0.4 | -3.9 | -7 |
Stddev | 13.33 | 17.4 | 1.2 | -3.4 | -0.4 | -7.9 |
Skewness | 0.554 | 0.41 | 0.3 | 0.26 | 0.15 | -0 |
Kurtosis | 2.7 | 3.46 | 3.9 | 5.15 | 0.57 | 2.97 |
PSD | 4.78 | 1.81 | 0.2 | 2.1 | 1.9 | 0.3 |
Entropy | -4.8 | -1.05 | -1.5 | -4.6 | -3.9 | -11 |
Table 8.3: Extracted Feature from subject 3
Feature | F | L | R | B | S | N |
Mean | -4.12 | -1.4 | 0.1 | 2.7 | 0.8 | -7.7 |
Median | -9.03 | -1.5 | -1.5 | 0.15 | -2.9 | -8.5 |
Stddev | 10.09 | 17.2 | 0.8 | -0.3 | -4.59 | -7.9 |
Skewness | 0.69 | 0.53 | 0.3 | 0.12 | 0.22 | -0 |
Kurtosis | 2.7 | 3.99 | 4.1 | 4.14 | 5.57 | 3.11 |
PSD | 6.22 | 1.9 | 0.2 | 1.8 | 3.01 | 0.79 |
Entropy | -1.8 | 1 | 1 | -4 | -4.8 | -11 |
Table 8.4: Extracted Feature from subject 4
Feature | F | L | R | B | S | N |
Mean | -3.23 | -1.5 | -1.3 | 2.3 | 0.6 | -7.7 |
Median | -9.03 | -1.2 | -1.4 | 0.25 | -2.7 | -6.7 |
Stddev | 8.23 | 18.1 | 4.5 | 4.78 | -6.69 | -7.9 |
Skewness | 0.6 | 0.45 | 0.2 | 0.1 | 0.2 | -0 |
Kurtosis | 2.7 | 4.11 | 3.6 | 4.5 | 5.5 | 3.41 |
PSD | 5.18 | 2.39 | 0.2 | 2.48 | 2.95 | 1.6 |
Entropy | -3.49 | -1 | -1.7 | -3.7 | -1.9 | -11 |
Table 8.5: Extracted Feature from subject 5
Feature | F | L | R | B | S | N |
Mean | -2.69 | -1.6 | -2.1 | 1.7 | 1.56 | -7.7 |
Median | -9.03 | -1.49 | -1.1 | 0.7 | -1.7 | -9 |
Stddev | 7.8 | 17.5 | 6.9 | 6.7 | -3.5 | -7.9 |
Skewness | 0.71 | 0.41 | 0.3 | 0.09 | 0.17 | -0 |
Kurtosis | 2.7 | 4.13 | 3.5 | 4.85 | 5 | 2.8 |
PSD | 6 | 2.5 | 0.2 | 3.09 | 2.54 | 1.1 |
Entropy | -2.25 | -1.6 | 0.8 | -5.9 | -4.25 | -11 |
After the feature extraction we applied Principal Component Algorithm (PCA) to reduce directionality. PCA was used to highlight the most needed information and erase the redundant data from the feature. The example of applying PCA on the subject for the decision forward is given by the Figure 8.8 below.
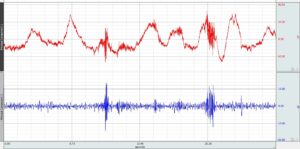
Figure 8.8: Applying PCA for decision forward for subject 1
8.3 Classification
This research develops two classifiers for EEG signals: Fuzzy Inference System (FIS) and Adaptive Neuro-Fuzzy Inference System (ANFIS). FIS relies solely on fuzzy logic, while ANFIS integrates Neural Networks for enhanced adaptability. Both aim to classify features into mental task categories for BCI applications.
Key design criteria include appropriate inputs and outputs, a balanced rule base, low complexity, error rates under 10%, and accuracy above 80%. These classifiers ensure reliable and efficient real-time task classification for system control. In the table below, abbreviations are used: H (High), VH (Very High), M (Medium), L (Low), VL (Very Low).
8.3.1 FIS Classifier
Mean | Median | Stddev | Skewness | Kurtosis | PSD | Entropy | Decision |
M | VL | H | VH | VL | VH | H | Forward |
H | VH | VH | H | M | M | VH | Left |
H | VH | M | M | M | VL | VH | Right |
VH | H | L | M | VH | M | H | Backward |
VH | VH | M | L | H | M | M | Stop |
VL | L | VL | VL | L | L | VL | Nomovement |
M | VL | H | VH | VL | VH | Forward | |
H | VH | VH | H | M | M | Left | |
H | VH | M | M | M | VL | Right | |
VH | H | L | M | VH | M | Backward | |
VH | VH | M | L | H | M | Stop | |
VL | L | VL | VL | L | L | Nomovement | |
M | VL | H | VH | VL | Forward | ||
H | VH | VH | H | M | Left | ||
H | VH | M | M | M | Right | ||
VH | H | L | M | VH | Backward | ||
VH | VH | M | L | H | Stop | ||
VL | L | VL | VL | L | Nomovement |
Performance of FIS Classifier
Total number of classifications = 36
Number of misclassifications Nerror = 3
Number of correct classifications Ncorrect = 36 – 3 = 33
Error of FIS classifier PD = 3/36 = 0.083
Percentage of error (%) = 8.3%
Accuracy of the FIS classifier PB = 33/36 =.917
Accuracy is also PB = (1- .083) = .917
Percentage of Accuracy (%) = 91.7%
Smooth modifications= = 0.16553
Our Proposed Centroid Method for the measurement of accuracy and error:
The centroid method is proposed to calculate the degree of deviation in a subject’s decision for a specific mental task. This method helps evaluate the error and accuracy of each decision. For the FIS classifier, every decision has a designated center. For example, the center for the “forward” decision is 5, within a range of 0 to 10.
EEG signals vary across subjects and conditions. When the FIS classifier processes a forward decision, the decision center may deviate either to the right (negative deviation) or to the left (positive deviation). A deviation below 70% is considered “good,” while a deviation exceeding 70% is classified as “bad.
Table: Calculation of degree of deviation of decision and the condition of the decision for subject 1
Range | 0-10 | 20-10 | 20-30 | 30-40 | 40-50 | 50-60 |
For subject 1 | F | L | R | B | S | N |
Ideal Value | 5 | 15 | 25 | 35 | 45 | 55 |
Real Value | 5.97 | 24.6 | 23.7 | 35.01 | 41.6 | 54.99 |
Deviation | -0.97 | 5 | 1.33 | -0.01 | 3.38 | 0.01 |
Deviation (%) | 19.4 | 100 | 26.6 | 0.13 | 67.6 | 0.2 |
Condition | Good | Misclassification | Good | Good | Good | Good |
Table: Calculation of degree of deviation of decision and the condition of the decision for subject 2
Range | 0-10 | 20-10 | 20-30 | 30-40 | 40-50 | 50-60 |
For subject 1 | F | L | R | B | S | N |
Ideal Value | 5 | 15 | 25 | 35 | 45 | 55 |
Real Value | 6.33 | 14.7 | 25.7 | 32.7 | 45 | 54.9 |
Deviation | -1.33 | 0.3 | -0.73 | 2.3 | -0.01 | 0.1 |
Deviation (%) | 26.6 | 6 | 14.6 | 46 | 0.12 | 2 |
Condition | Good | Good | Good | Good | Good | Good |
Table: Calculation of degree of deviation of decision and the condition of the decision for subject 5
Range | 0-10 | 20-10 | 20-30 | 30-40 | 40-50 | 50-60 |
For subject 1 | F | L | R | B | S | N |
Ideal Value | 5 | 15 | 25 | 35 | 45 | 55 |
Real Value | 6.86 | 18.89 | 26.1 | 29.2 | 41.8 | 53.56 |
Deviation | -1.14 | -3.89 | -1.13 | 5 | 3.19 | 1.44 |
Deviation (%) | 37.2 | 77.8 | -22.6 | 100 | 63.8 | 28.8 |
Condition | Good | Bad | Good | Misclassification | Good | Good |
Comparison of classifiers:
Name of the classifier | Accuracy (%) |
Parzen | 77.27 |
KNN | 93.16 |
NN | 93.76 |
Bayes | 88.58 |
FIS | 91.7 |
SVM | 95.5 |
LDA | 94.5 |
LC | 76 |
ANN | 85 |
8.3.2 ANFIS Classifier
The goal of a classifier is to maximize accuracy and minimize errors, ensuring consistent performance on both training and unseen test data. Overtraining, marked by significantly higher training accuracy, is avoided by using validation subsets as “pseudo-tests.” Larger datasets improve reliability and generalization.
Performance of ANFIS Classifier
The theory of the performance measurement is given in the part 8.4.1.1. And the process of calculation of accuracy and error is same.
Accuracy an Error calculation:
Total number of classifications = 36
Number of misclassifications Nerror = 1
Number of correct classifications Ncorrect = 36 – 1 = 35
Error of FIS classifier PD = 1/36 = 0.028
Percentage of error (%) = 2.8%
Accuracy of the FIS classifier PB = 35/36 =.973
Accuracy is also PB = (1- .083) = .973
Percentage of Accuracy (%) = 97.3%
Smooth modifications = 0.0284
Our Proposed Centroid Method for the measurement of accuracy and error:
Table: Calculation of degree of deviation of decision and the condition of the decision for subject 1
Range | 0-10 | 20-10 | 20-30 | 30-40 | 40-50 | 50-60 |
For subject 1 | F | L | R | B | S | N |
Ideal Value | 5 | 15 | 25 | 35 | 45 | 55 |
Real Value | 5.24 | 19.18 | 25.1 | 31.2 | 48.6 | 55 |
Deviation | -0.24 | -4.18 | 0.14 | 3.8 | -3.56 | 0 |
Deviation (%) | 4.8 | 83.6 | 2.8 | 76 | 71.2 | 0 |
Condition | Good | Bad | Good | Bad | Bad | Best |
Table: Calculation of degree of deviation of decision and the condition of the decision for subject 2
Range | 0-10 | 20-10 | 20-30 | 30-40 | 40-50 | 50-60 |
For subject 1 | F | L | R | B | S | N |
Ideal Value | 5 | 15 | 25 | 35 | 45 | 55 |
Real Value | 2.97 | 15.17 | 22.7 | 39.54 | 43.1 | 55 |
Deviation | 2.03 | -0.17 | 2.35 | -4.54 | -1.89 | 0 |
Deviation (%) | 40.6 | 3.4 | 47 | 90.8 | 37.8 | 0 |
Condition | Good | Good | Good | Bad | Good | Best |
Table: Calculation of degree of deviation of decision and the condition of the decision for subject 5
Range | 0-10 | 20-10 | 20-30 | 30-40 | 40-50 | 50-60 |
For subject 1 | F | L | R | B | S | N |
Ideal Value | 5 | 15 | 25 | 35 | 45 | 55 |
Real Value | 2.97 | 15.65 | 23.2 | 38.95 | 47.8 | 55 |
Deviation | 2.03 | -0.64 | 1.76 | -3.95 | -2.84 | 0 |
Deviation (%) | 40.6 | 12.8 | 35.2 | -79 | 56.8 | 0 |
Condition | Good | Good | Good | Bad | Good | Best |
Comparison of classifiers:
Name of the classifier | Accuracy (%) |
Parzen | 77.27 |
KNN | 93.16 |
NN | 93.76 |
Bayes | 88.58 |
FIS | 98 |
SVM | 95.5 |
LDA | 94.5 |
LC | 76 |
ANN | 85 |